Stafford Manufacturing

Case study · Industrial components · Since 2025

Marketing strategy and data-driven execution for a 50-year-old manufacturer of shaft collars and couplings. Every major decision started with Stafford's own data, from how buyers use the website to five years of distributor sales.

  • Marketing strategy
  • Website
  • Distributor programs
  • CRM
  • Brand
  • Trade shows
  • Ecommerce
Stafford 50th anniversary lockup: the 50th Anniversary mark beside the new Stafford logo
The 50th anniversary lockup.

The results, per visit to the site

2x
visits ending in a quote request
2.4x
online catalog visits ending in a purchase
4x
visits using site search
$25K+
saved on HubSpot over two renewals
+63%
visits with a form submission
+53%
visits with an add to cart

Per-visit figures from Microsoft Clarity, January 8 to April 24, 2026 compared with April 24 to October 1, 2026.

Before Jay, our marketing happened in bursts — whenever someone had a spare hour, which wasn't often. As a family-owned manufacturer, we knew our products and our customers, but we didn't have anyone turning that into clear, consistent messaging. Now we do. Jay writes product copy that holds up with our distributors, and he understands the engineering well enough that we don't have to translate for him. My advice to another manufacturer: you don't need a big in-house department, you need someone who takes the time to learn your business.

Shelley Doherty, Second-Generation Owner and Director of Business Development, Stafford Manufacturing

Every decision started with the data

When we started working with Stafford in early 2025, the company had a strong product line, a 50-year reputation, and years of data that could tell us where to focus. Rather than guessing at what to fix, we started each project with what Stafford's own numbers said.

Channels

Distributors

What the data showed
Five years of sales for Stafford's top 30 distributors.
What we did
Worked with the Stafford team to pursue contracts with key distributors, then set up the programs: announcements, an outreach strategy, sales presentations, and marketing materials such as brochures and landing pages. Met with distributors to walk them through each program.
What changed
A distributor strategy built on each account's sales history.
Trade shows

What the data showed
The attendee lists for each show, reviewed before Stafford arrived.
What we did
Designed the supporting materials, including a booth for MD&M West, sales presentations, and marketing materials. Built an outreach strategy for before and during each show to reach as many people as possible.
What changed
Time at each show spent with customers, new and existing, in person.

Customers

What the data showed
Stafford's first OEM customer survey came back with a Net Promoter Score of +65. Customers also asked for a dedicated contact and more information on custom work.
What we did
Used what customers said to shape follow-up campaigns and the custom work on the website.
What changed
A +65 benchmark to measure future surveys against.

Systems

CRM

What the data showed
Most of the 26,000 contacts hadn't visited the site, opened an email, or bought in years. A survey of distributor contacts showed more than half of that list was out of date.
What we did
Set engagement rules based on site visits, email activity, and sales history, and kept only the active contacts in marketing.
What changed
26,000 contacts down to 7,500 active ones, and more than $25,000 saved on HubSpot over two renewals.

Lead scoring

What the data showed
The profile of Stafford's best customers: industry, company type, role, and location.
What we did
Replaced manual A through F grading with automated scoring, and set follow-ups to run automatically with no manual review.
What changed
The strongest leads rise to the top without anyone grading them by hand.

Quote follow-up

What the data showed
High-value quotes were tracked outside the CRM.
What we did
Set up a dedicated rep to follow up on high-value quotes by phone and email, tracked in the CRM. Rebuilt the quote request form as a two-step form that captures part numbers.
What changed
Every high-value quote has an owner and a follow-up.

Demand

Google Ads

What the data showed
A review of the search terms behind each click showed where the budget would go furthest.
What we did
Ran extensive negative keyword reviews to keep spend on the searches that lead to buyers.
What changed
The visitors who arrive now are the ones looking for what Stafford makes.

Ecommerce

What the data showed
The site and sales analytics made the case for a better ecommerce platform.
What we did
Made the business case and led the move of the catalog to WooCommerce.
What changed
One platform for the website and the catalog.

Website

What the data showed
More than 8,500 recorded visits in the first two weeks. Search was the most-used feature on the homepage, and the blog, press releases, and resources pages were almost never clicked.
What we did
Rebuilt the header and menu around search, and moved the low-use pages under one menu item.
What changed
Site search went from 11% to 17% of homepage clicks.

A homepage rebuilt from the heatmap

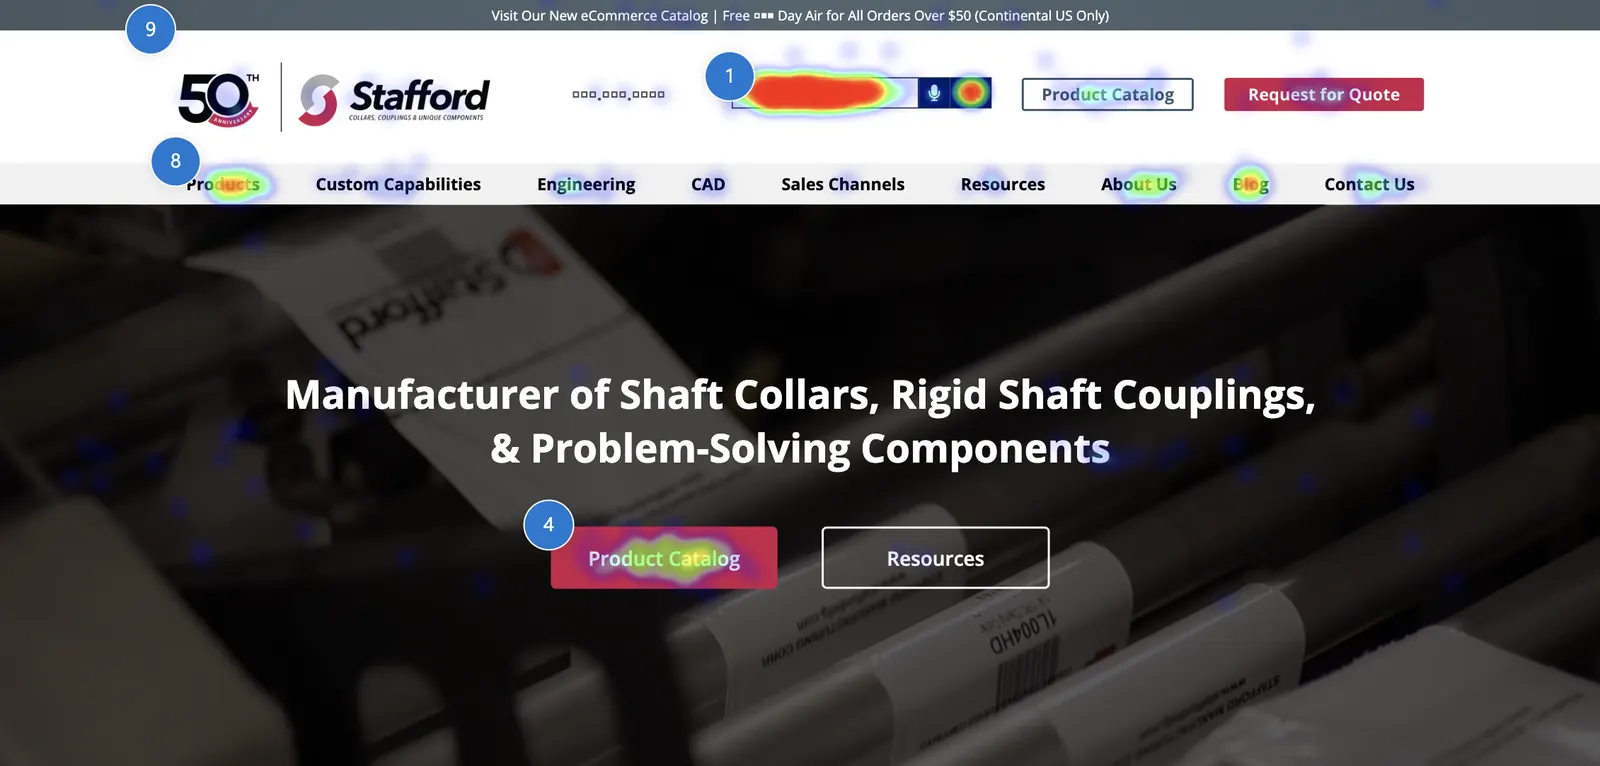
Microsoft Clarity recorded where visitors clicked on the old homepage. Every change on the new homepage traces back to that map.

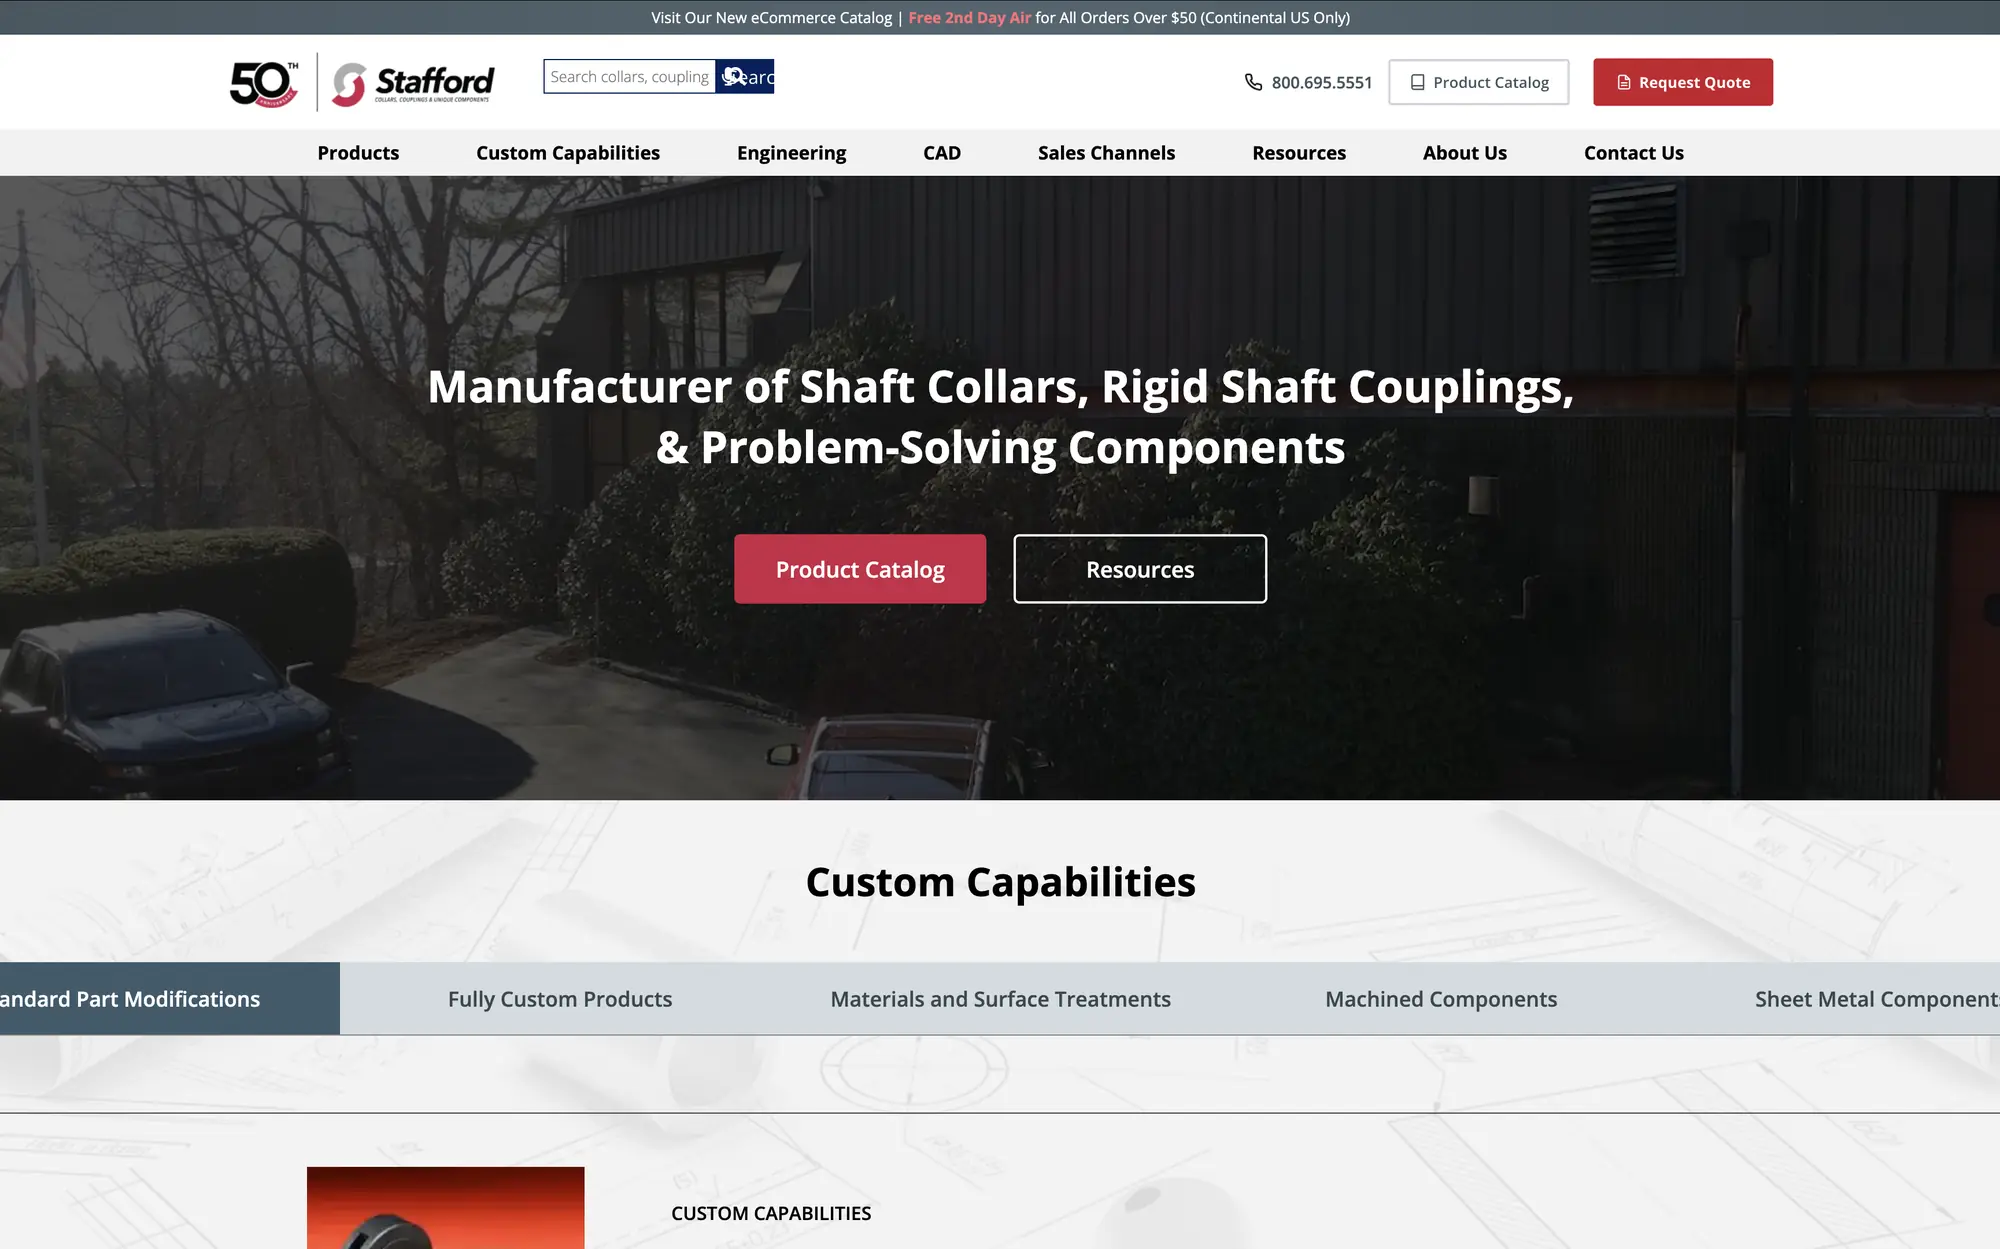
Click heatmap of the old Stafford homepage header and hero. The search box is red, the hottest spot on the page, and the Product Catalog button is also hot.
Header and heroRed marks the most clicks: the search box, then the Product Catalog button.
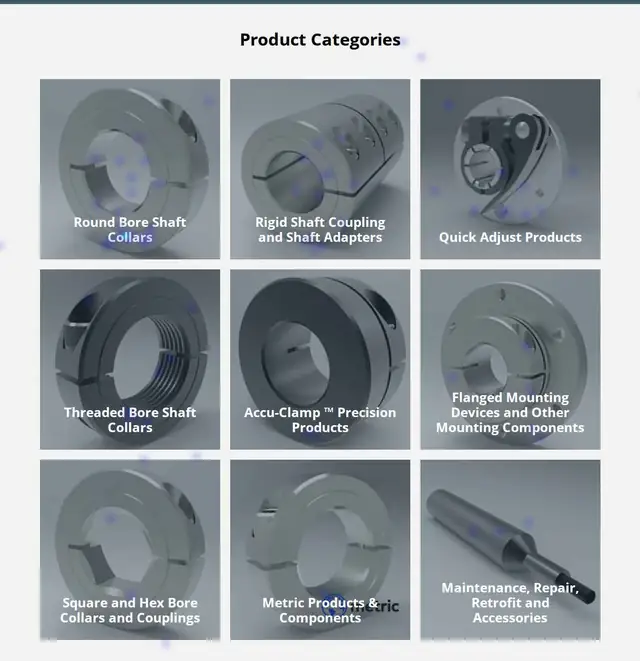
Click heatmap of the old product category grid, with only a few scattered clicks
Product gridNine large tiles, a few scattered clicks.
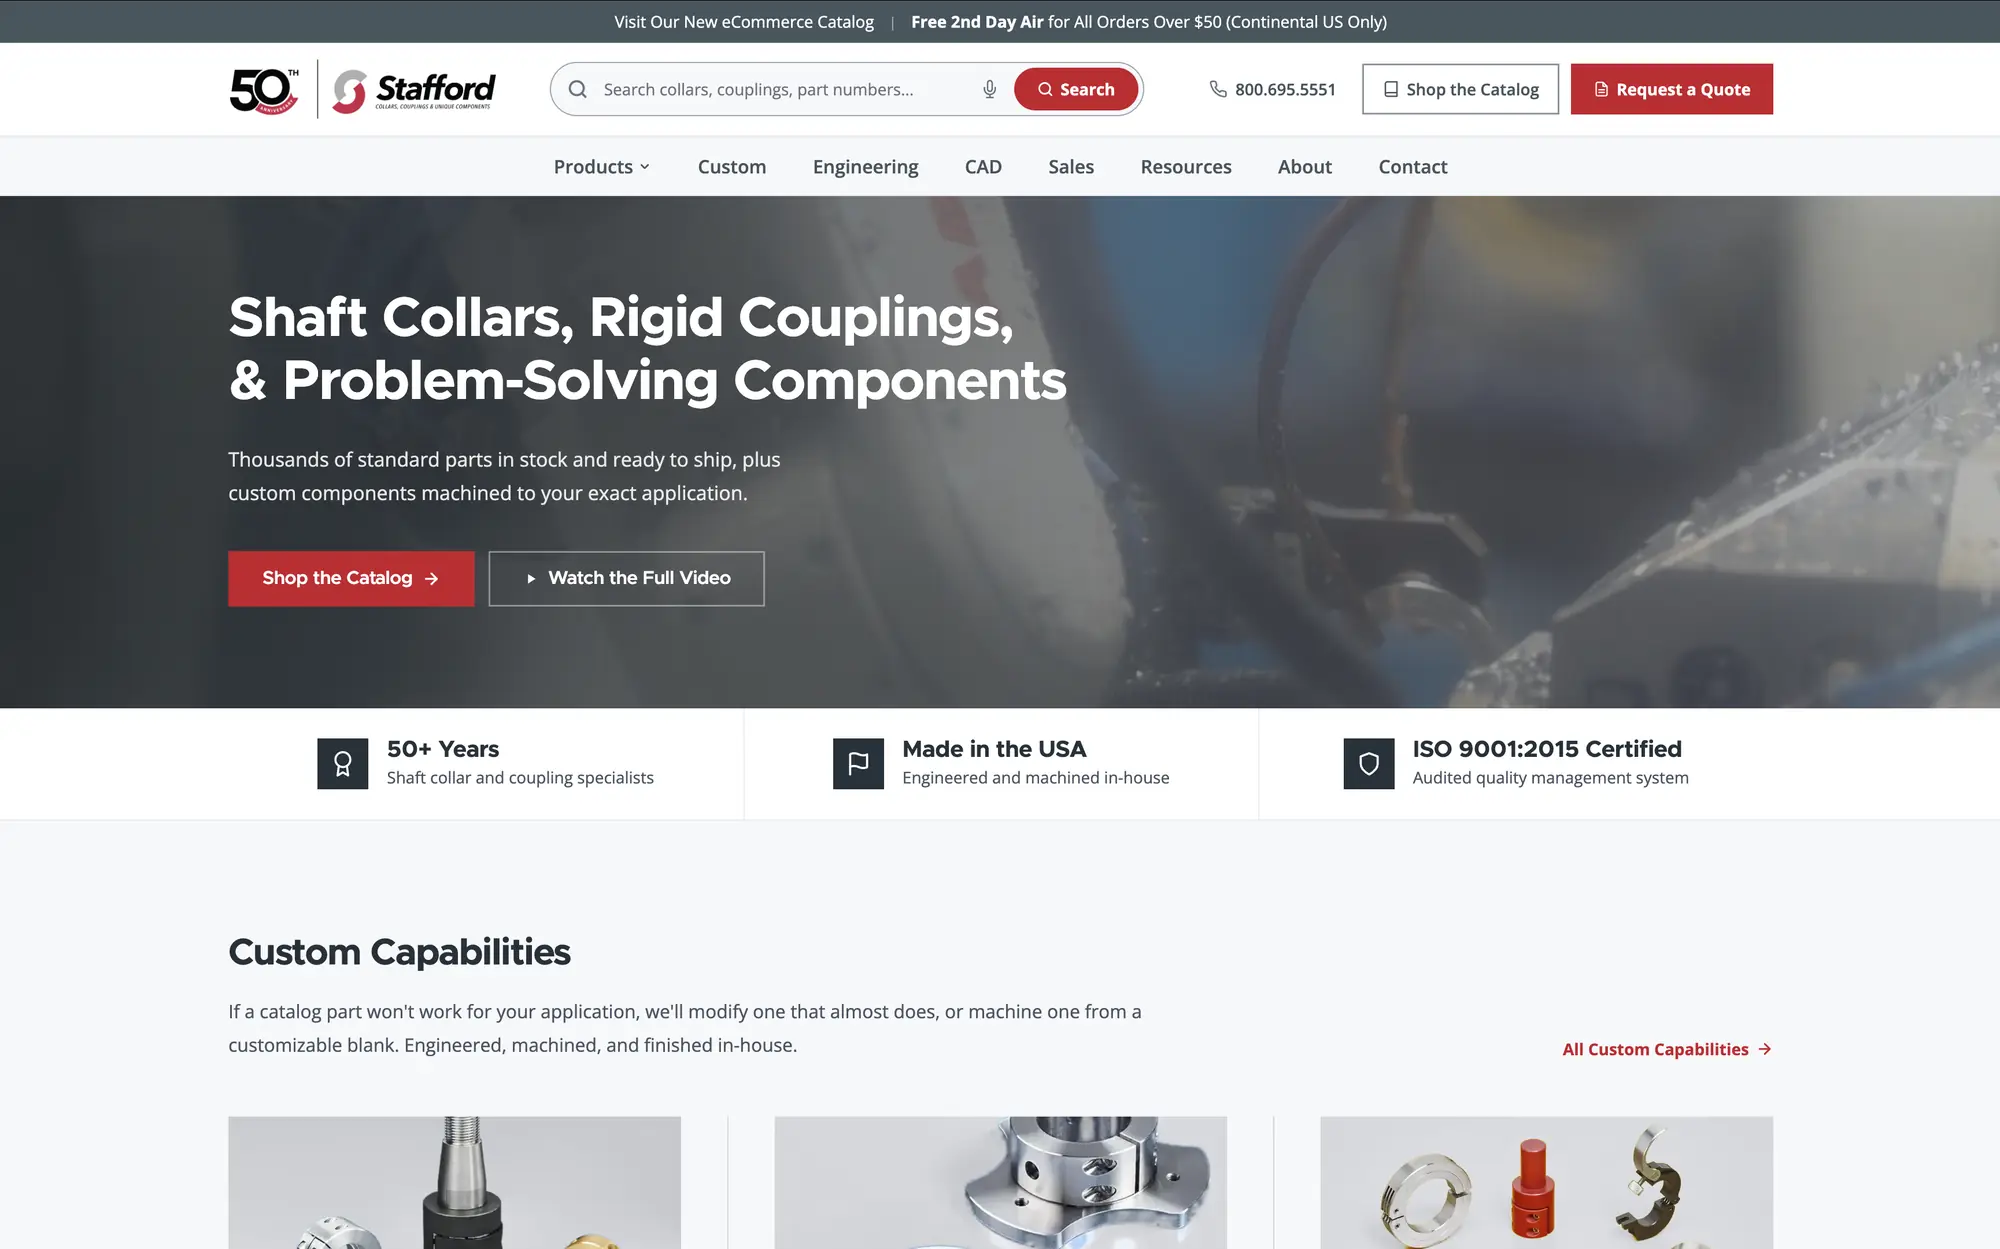
  1. Search, front and center

    What the heatmap showed

    The search box was the most-clicked spot on the page, and desktop visitors often clicked it first, even though it was small and tucked into the header.

    What changed

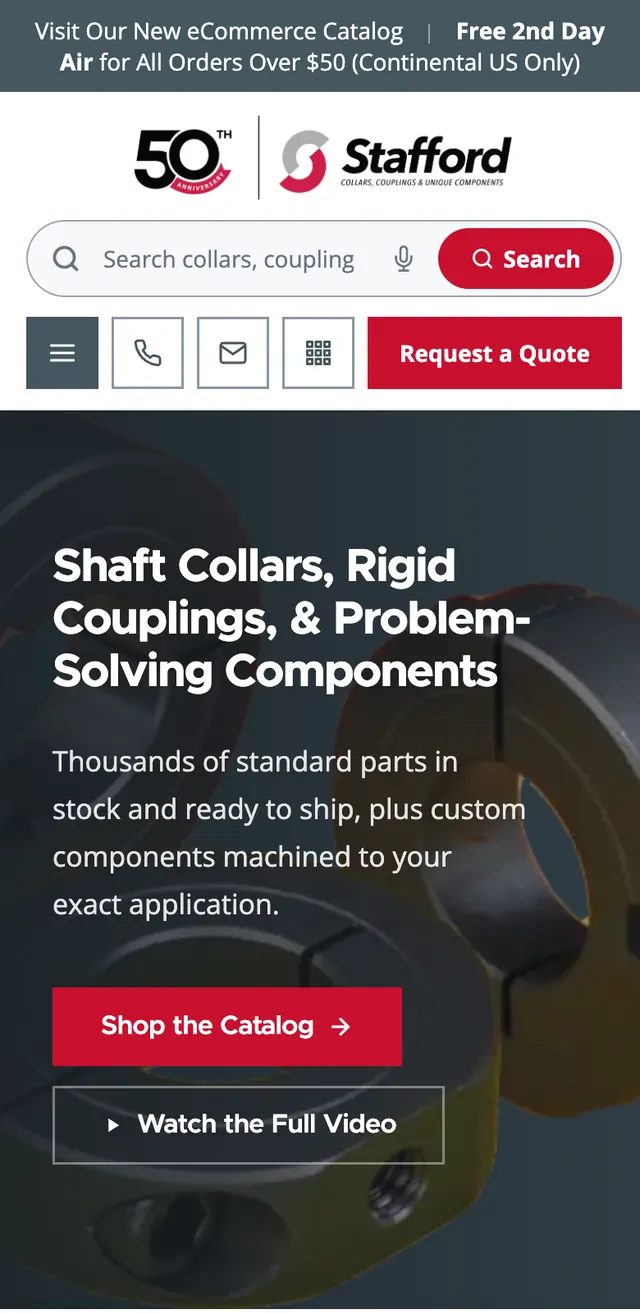
    A full-width search bar in the middle of the header that invites part numbers, and the same bar right under the logo on phones.

  2. The catalog in one click

    What the heatmap showed

    The Product Catalog button in the hero drew heavy clicks. On phones it was often the first and the last thing visitors tapped.

    What changed

    Shop the Catalog leads the hero on every device and sits in the header on desktop.

  3. A menu built around products

    What the heatmap showed

    Products was the most-clicked item in the menu.

    What changed

    Products now opens a dropdown with every product category. The other labels got shorter so the menu reads at a glance.

  4. Custom work stays near the top

    What the heatmap showed

    The custom capability tabs drew steady clicks, while the nine product tiles below them drew almost none. Stafford's OEM survey also asked for more information on custom work.

    What changed

    Custom Capabilities comes right after the hero and proof points, ahead of the product grid.

  5. A second button that earns its place

    What the heatmap showed

    The Resources button in the hero drew almost no clicks.

    What changed

    It was replaced with a link to the full factory video.

New Stafford homepage on desktop, with a full-width search bar, Shop the Catalog buttons, and Custom Capabilities right after the hero
Previous Stafford homepage on desktop
Drag to compare the old homepage with the new one.
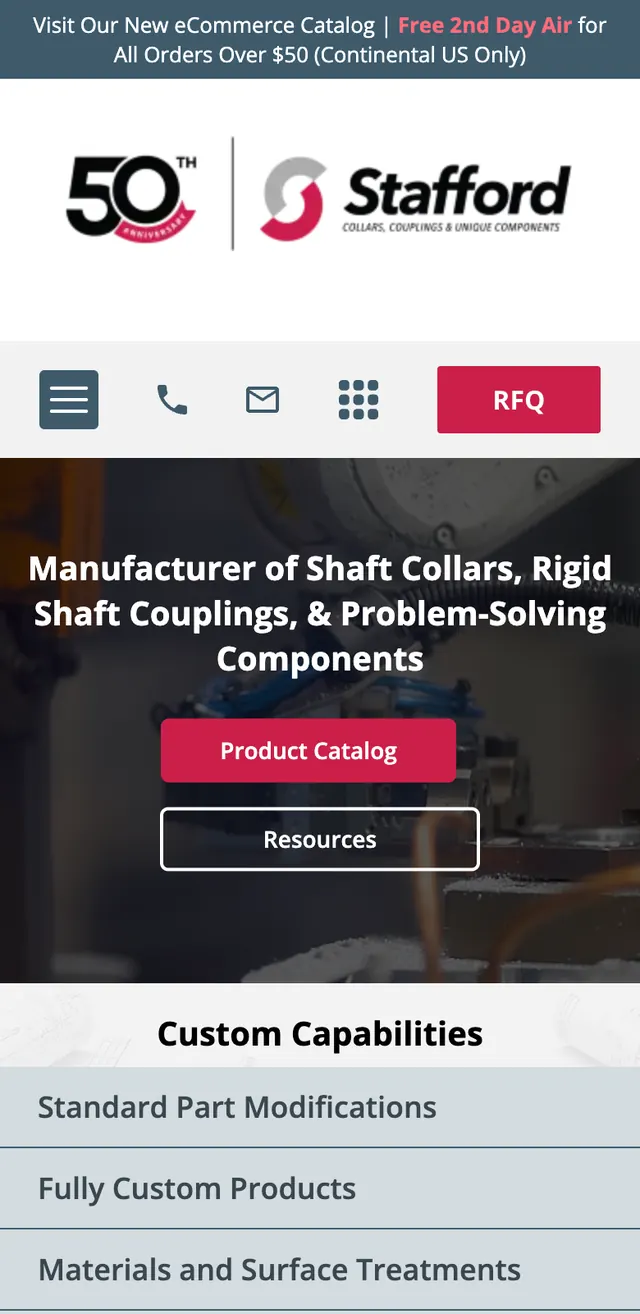
Previous Stafford homepage on a phone
Before
New Stafford homepage on a phone, with search under the logo and Shop the Catalog in the hero
After

On phones, search moves into the header and Shop the Catalog leads the page.

How visitors use the site now

Comparing the months before the website and ads overhaul with the months after.

Per visitChartBeforeAfterChange
Visits using site search0.33%1.29%4x
Visits with a quote request0.26%0.52%2x
Online catalog visits with a purchase0.51%1.22%2.4x
Visits submitting a form2.12%3.46%+63%
Visits adding to cart1.29%1.98%+53%
Visits downloading CAD and specs1.06%1.78%+68%
Active time on site73 sec118 sec+62%
Pages viewed1.92.5+33%

Source: Microsoft Clarity, January 8 to April 24, 2026 compared with April 24 to October 1, 2026.

The website numbers are the most visible part of the story. The bigger part is the distributor programs, quote follow-up, and customer work behind them, which have supported Stafford's growth every year since we started.

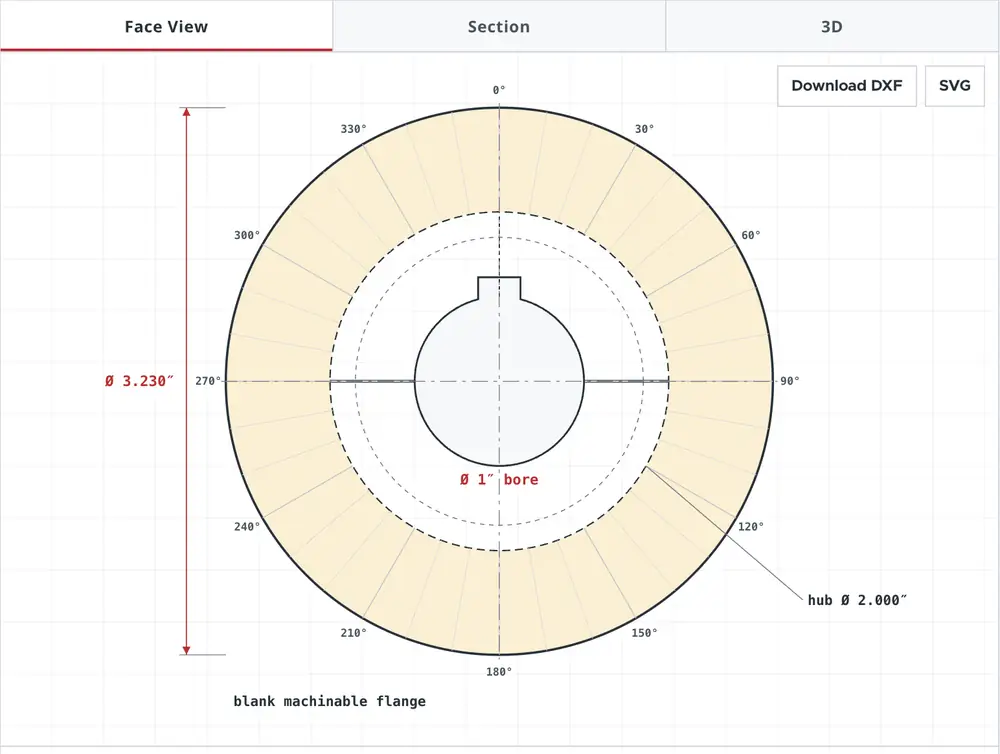
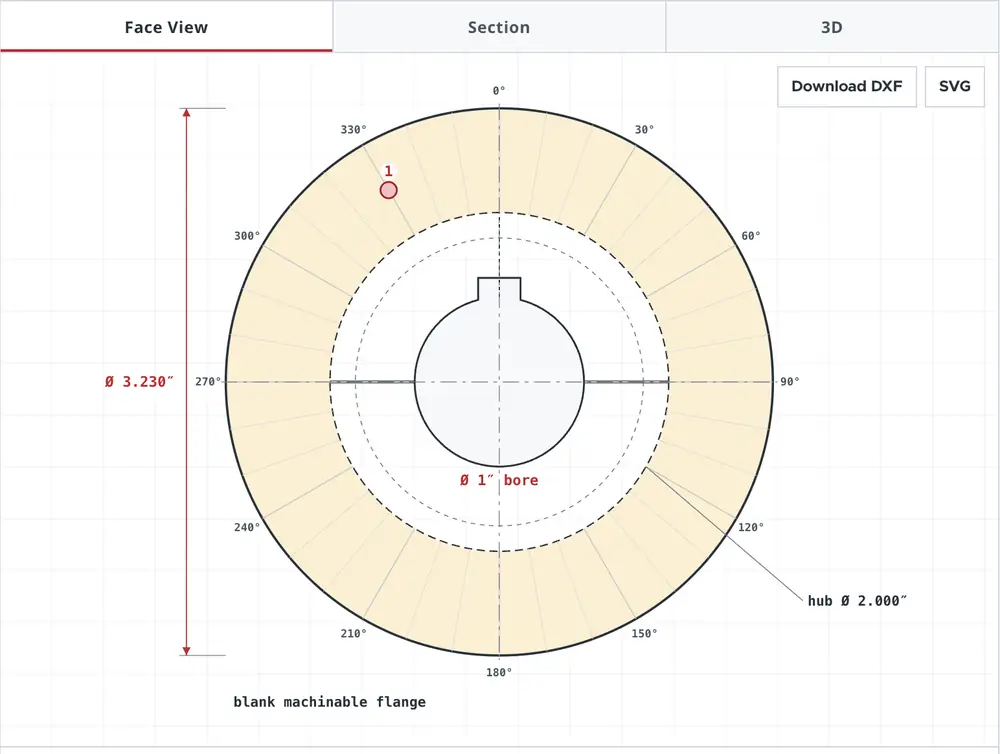
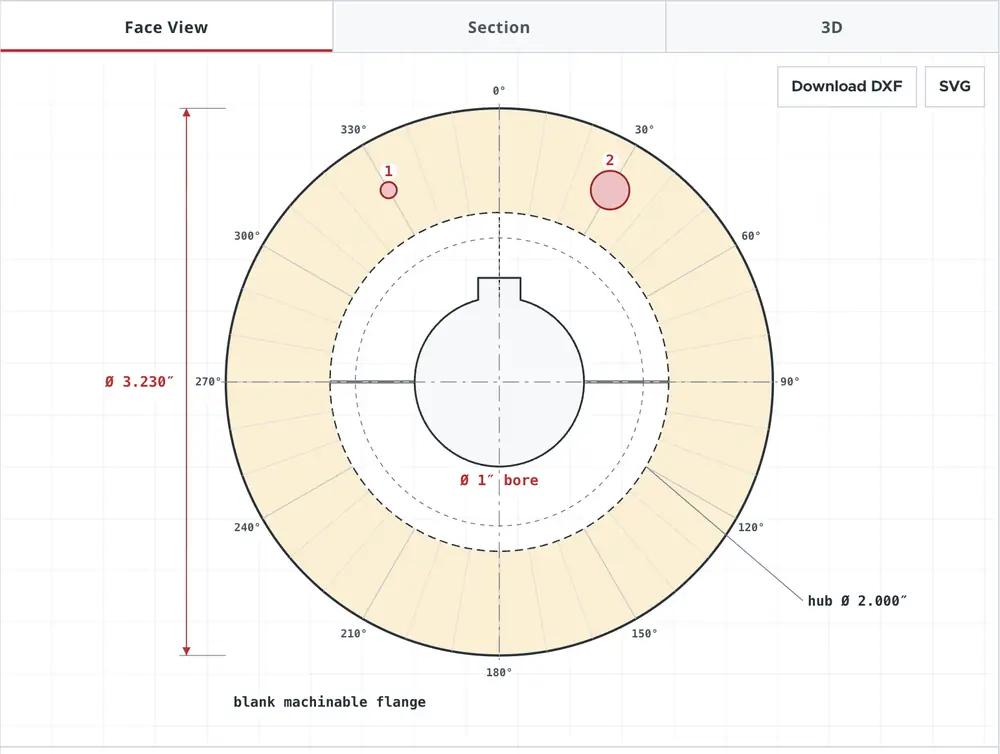
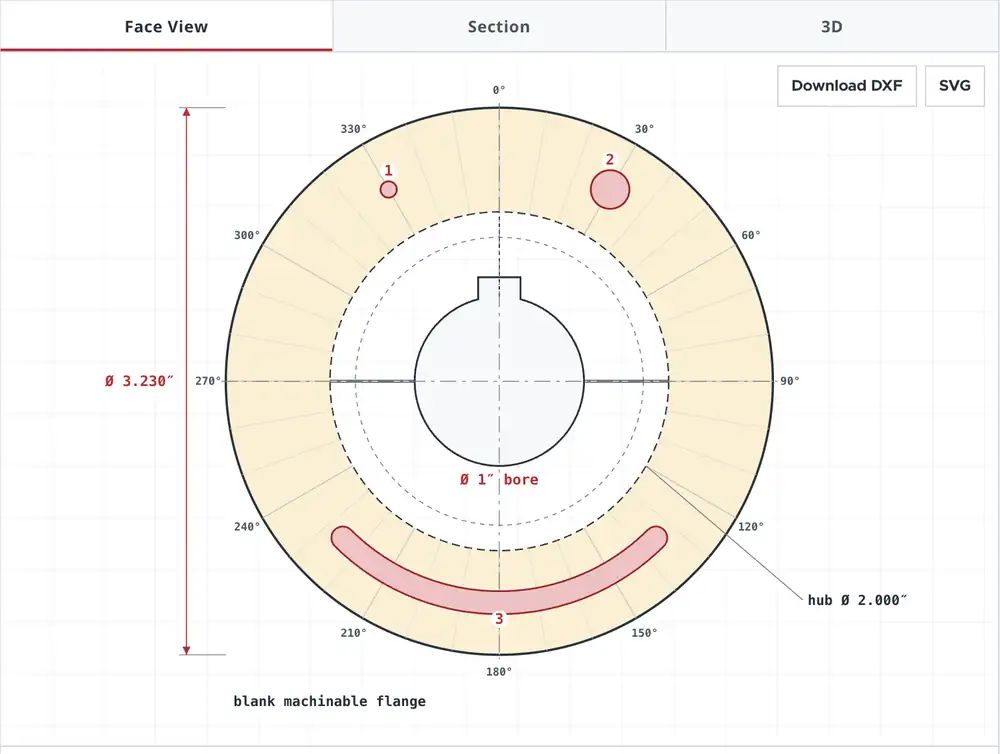
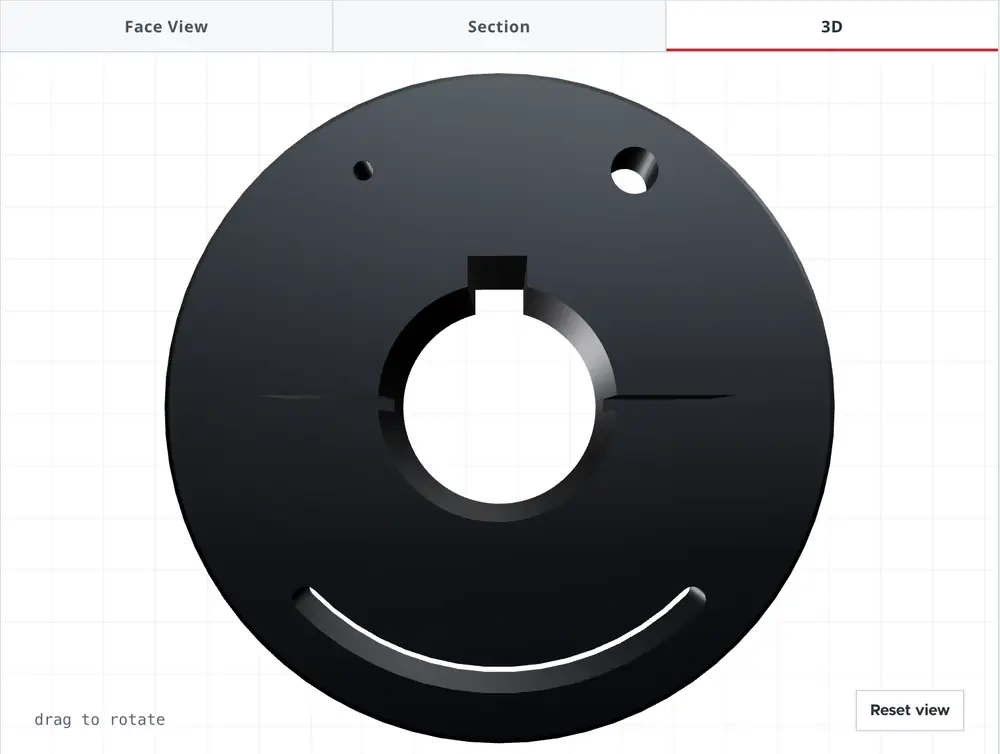
Accu-Flange configurator

Engineers pick a base part, bore, and material, place holes and slots on a live drawing, and get a part number and spec sheet before they request a quote. Every feature is checked against machining rules as it is placed, so the spec Stafford receives is one the shop can make.

Building a custom collar in the configurator.

A 50th anniversary mark built from the product

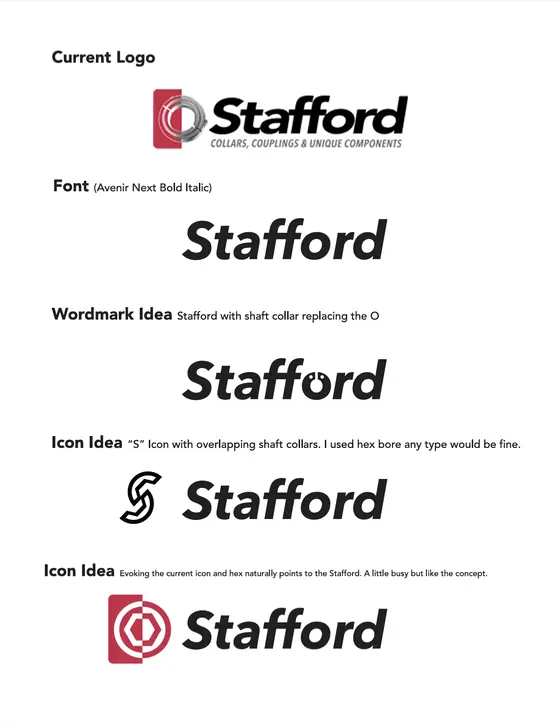
For Stafford's 50th anniversary, we wrote the creative brief, worked with designer Lindsay Zygadlo on the concept, and refined it into the final logo: two halves of a split shaft collar forming the S. We then ran the anniversary campaign.

New Stafford logo
Previous Stafford logo
Drag to compare the previous logo with the new one.
One-page logo brief showing the old Stafford logo, the Avenir Next Bold Italic typeface, and concept sketches
1. The briefThe old logo, the typeface, and concept directions, including an S built from shaft collars.
Designer concept: a split collar S beside the Stafford wordmark
2. The conceptLindsay's split-collar S, in the typeface from the brief.
Final Stafford logo
3. The final logoRefined angle and spacing between the collar halves, approved by Art.

Before and after

BeforeAfter
Each new contact reviewed by hand before follow-upFollow-ups run automatically, with no manual review
Leads graded by hand, A through FAutomated scoring based on fit and engagement
About 26,000 marketing contacts7,500 active contacts and more than $25,000 saved on HubSpot
Quotes tracked outside the CRMA dedicated rep follows up on high-value quotes by phone and email, tracked in the CRM
A one-step quote request formA two-step quote form that captures part numbers
Site search at 11% of homepage clicksA menu built from visitor data, with site search at 17% of homepage clicks

Want to know what your data says?

Most manufacturers already have the answers in their website, CRM, and sales history. They just haven't looked. A Growth Audit shows you where you stand and what to fix first.